
EEVEE cascading profiler
The EEVEE render engine is a fantastic tool, especially for those who can't afford to spend too much time on rendering their scenes.
It can be a bit of a mystery where your render times go. Sometimes small changes can have huge implications on render times. To those with experience with real-time engines things are a bit more predictable, but for less experienced people you might be stuck trying to turn objects, lights, and settings on and off. With larger scenes / projects, this can be a major task.
It doesn't have to be this way: in a rasterizer like EEVEE, each object's, light's, or effect's contribution to the total rendertime can be determined relatively easily and accurately.
A profiler would help tremendously in such a situation. Unreal Engine 4 comes with such a profiler, and it looks a like this:
In terms of UX it is a bit lacking, and the label names are a bit confusing, but it helps a lot when dealing with a scene that's over frame time budget.
I propose a similar profiler for EEVEE.
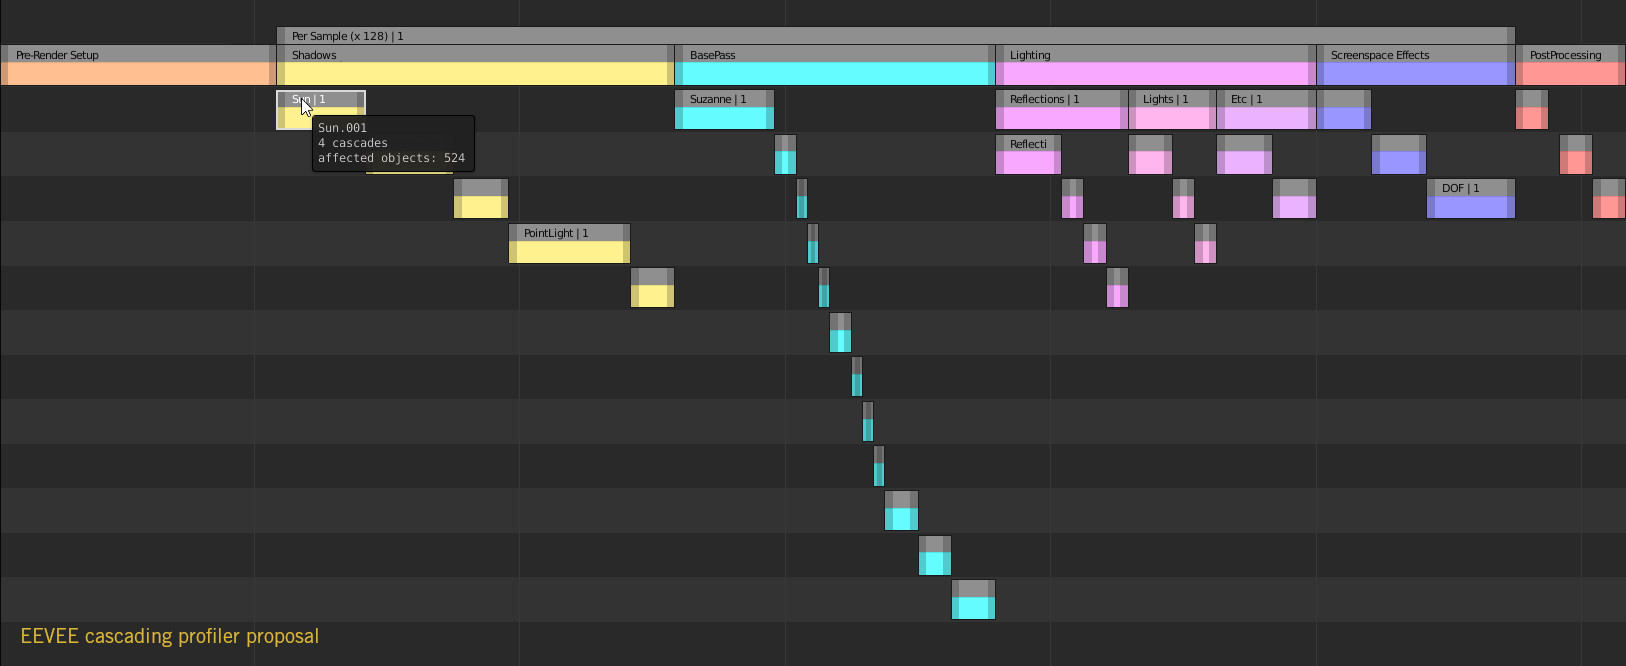
I haven't looked too deeply into the render code, but if it looks anything like other deferred renderers, a cascading profiler would look a little bit like this:
Each stage's contribution is displayed horizontally, with a more detailed break down cascading underneath.
Hovering over a block could show more info. For a shadow pass this might be the name, effective range, resolution, affected objects, affected number of polygons.
Of course, this does not yet take into account additional passes like grabpasses for transparency, planar reflections, but I'm confident that it would fit into a system like this.
The fact that EEVEE works by jittering all sorts of aspects per frame might also cause some trouble. For example, the number of objects rendered into a shadow pass might be different per frame. Perhaps an average would work in such a situation.
Let me know if you'd benefit for a feature like this, or what you'd like to see different!
2 Comments
Brilliant idea to use the vse for visualizing a profiling. Btw.: youtu.be/KRJkBxKv1VM
With UPBGE being built on top of EEVEE, this is a huuuuuge help there too.