
Simple frame profiling for viewport
In Unreal Engine there is this thing called Profiling where you can see within a frame HOW long each thing takes to make the frame(Physics, shading) etc. Its a great way to detect serious problems with your scene.
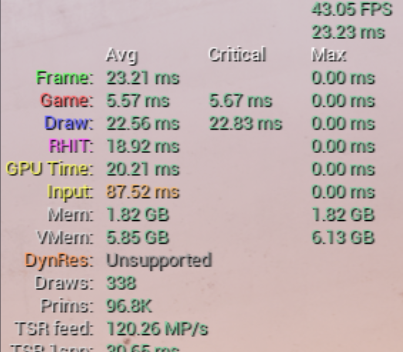 Now for production renderers we all know that 99% of the time spent in a frame is on path tracing. That part is pretty much a given. However in the viewport when your editing things(This includes wireframe, shaded, material, and rendered mode) and blender is being extremely slow and laggy and you cant playback a animation in wireframe at 24fps. I think that a simple frame profiling system showcasing what is taking the longest in the scene would help users.
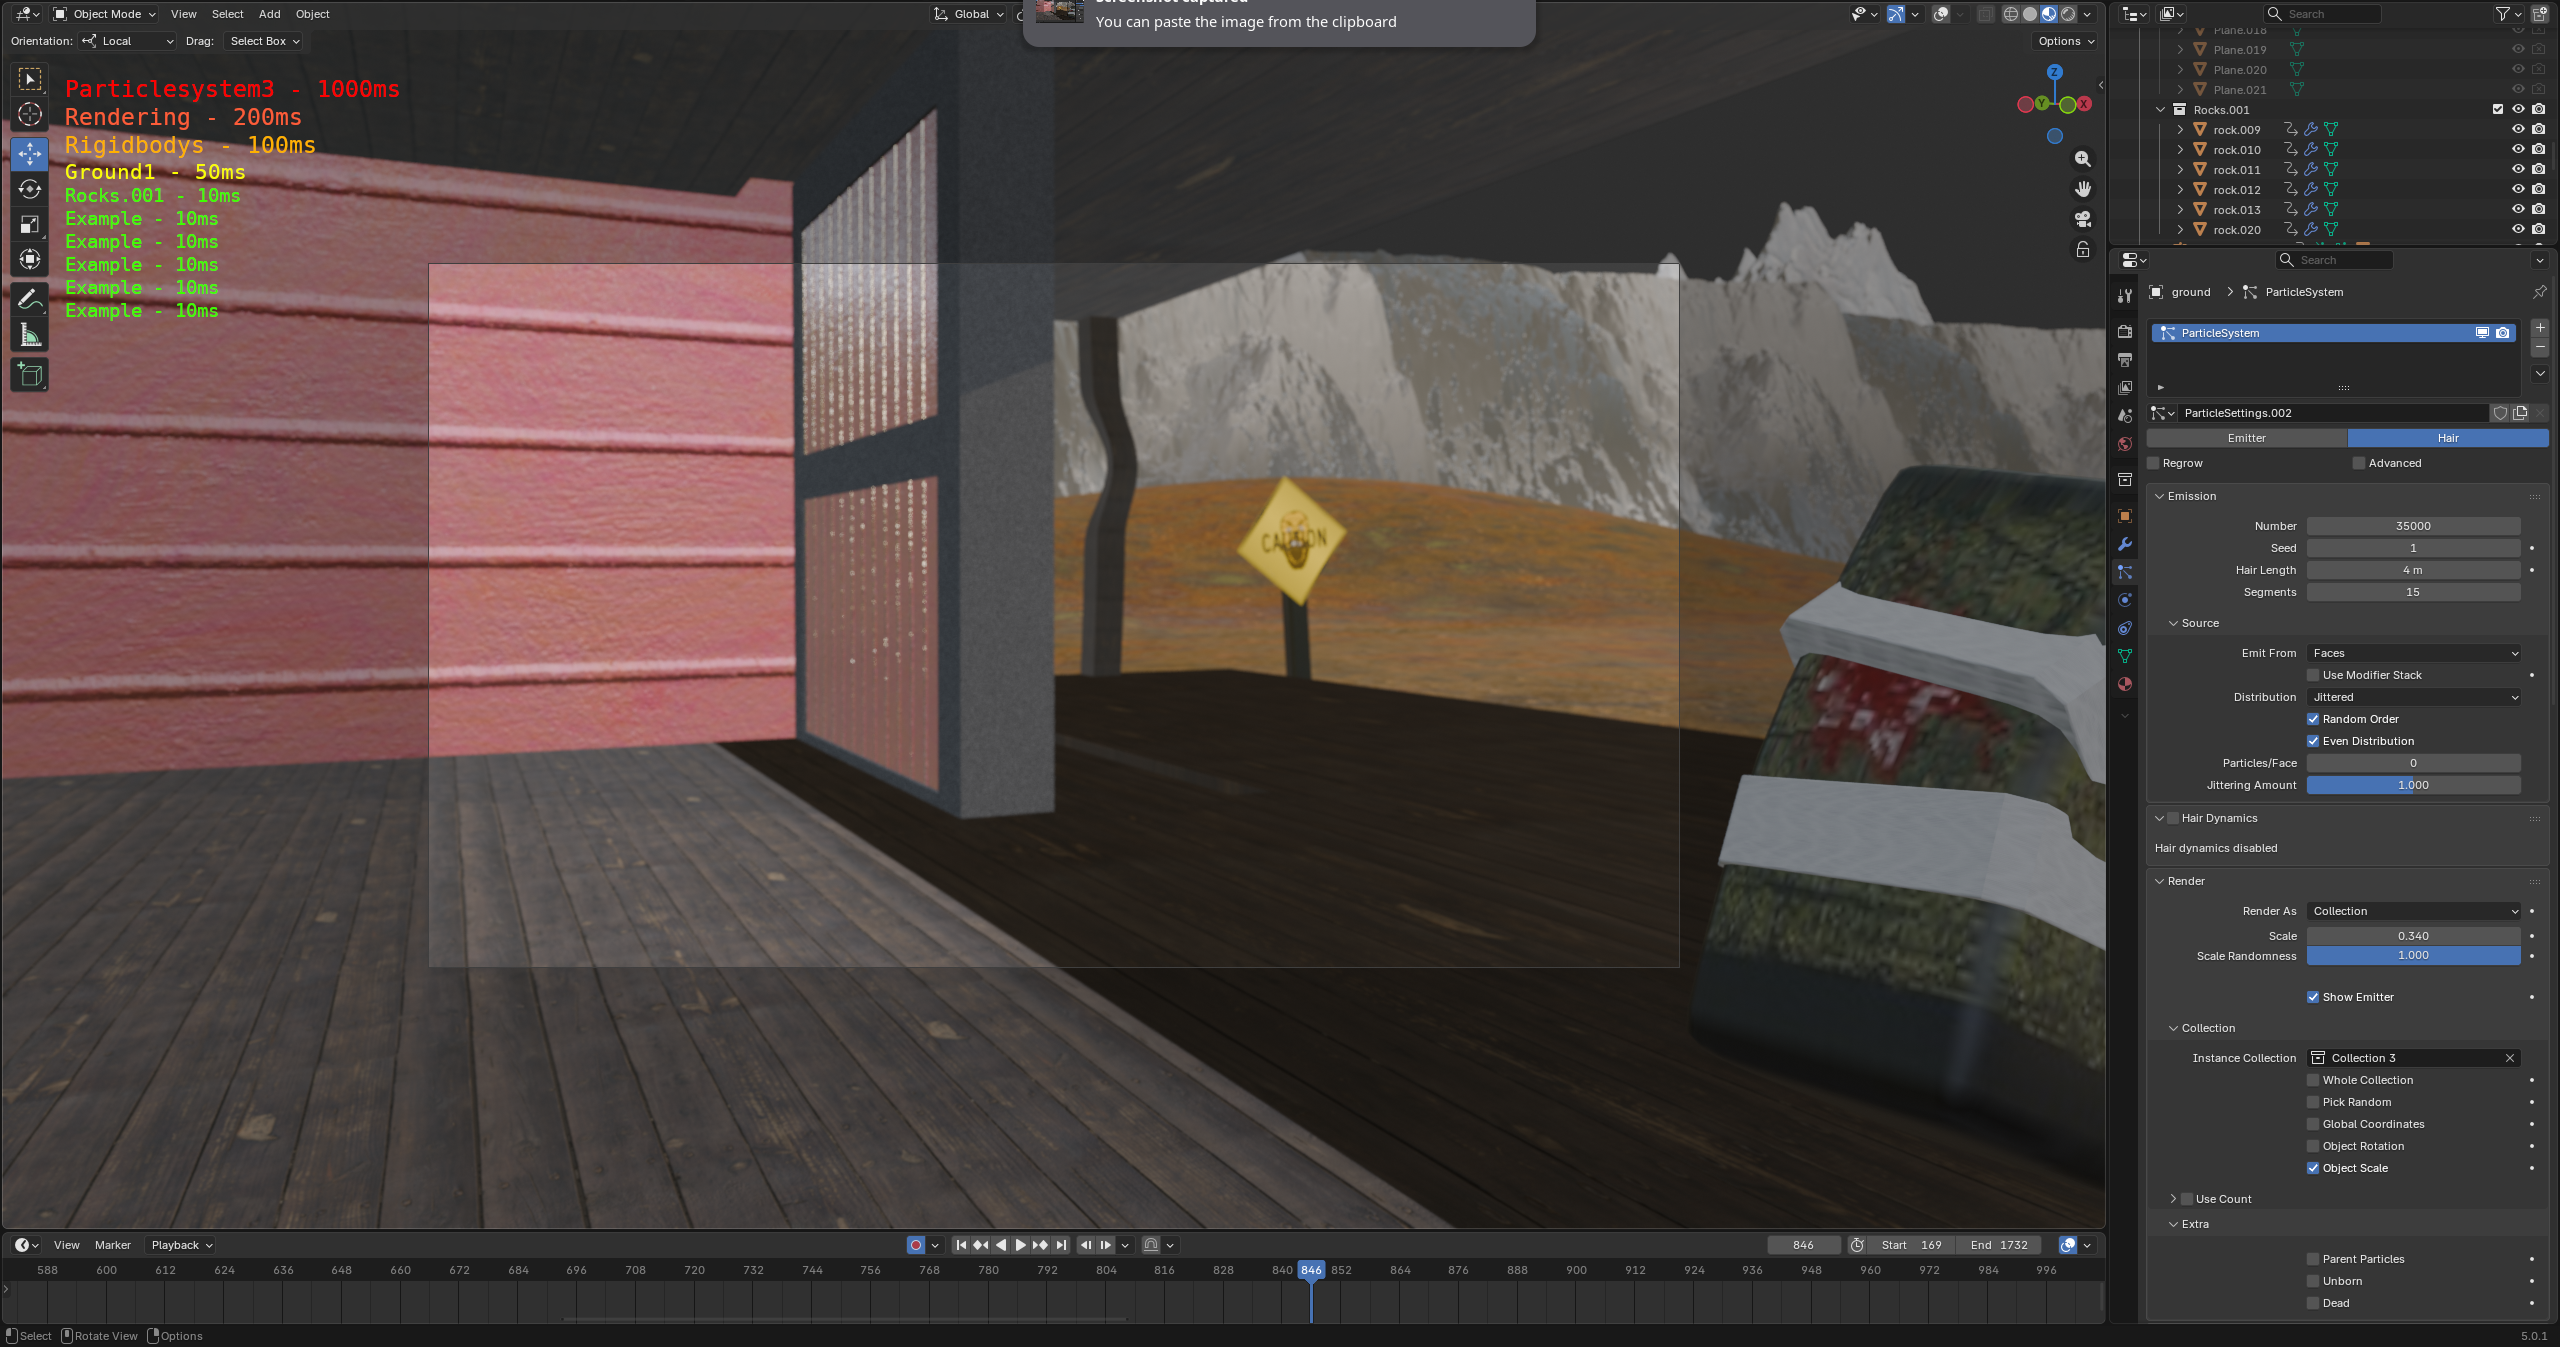
My idea for this is that when enabled, the top left of the screen will show small text similar to the unreal example I provided. Where the top ten(This can be shortened or increased in how much stuff should be logged) stuff that is taking the LONGEST in a single frame is logged and ordered from greatest(top) to least (bottom .. of course still on the top left.. I don't mean bottom as in it goes all the way to the bottom of the screen) Allowing you to see easily identify WHAT is making your viewport so slow and sluggish and be better able to optimize your scene.
This would not show stuff like Vmem or memory or hardware statistics. it would simply show the things that are taking the longest in your scene ordering from the worst.
Here is a brief Mockup I quickly made showing of what it could look like(Yeah the text would not be that big in a real implementation.. I made it big for demonstration.)
 .
.
1 Comment
It is planned, see #156220 - Tracy Frame Profiler Dependency Proposal - blender - Blender Projects