
Shader Complexity Visualizer
With larger scenes, it's essential to know which shaders are the most complex. Finding complex shaders and simplifying them can dramatically reduce render times - both Eevee and Cycles. Counting nodes within a shader or categorizing them by performance is arbitrary and unhelpful, as a single PBR shader can be high or low complexity depending on SSS or refraction settings. Having a visualizer in the viewport can allow quick feedback.
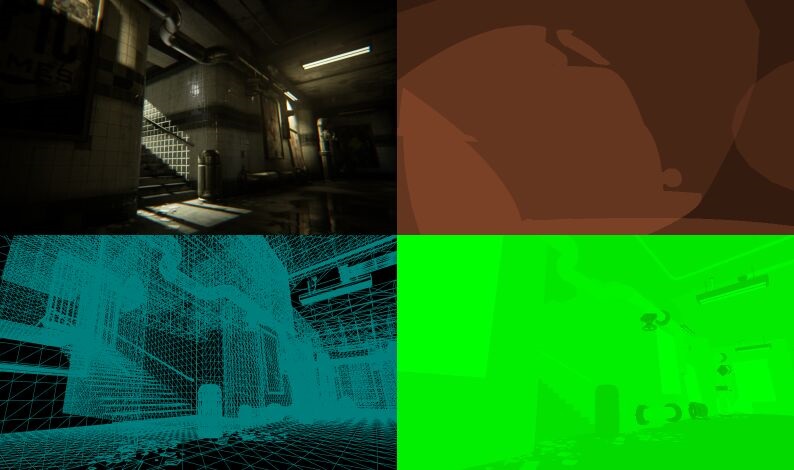
For performance and profiling purposes, Unreal has visualizers for both lighting and shader complexity (I will focus on shader only at this time, but lighting would be of benefit as well). Implementing something similar as a render pass would be immensely helpful.
docs.unrealengine.com/4.27/en-US/TestingAndOptimization/PerformanceAndProfiling/Overview/
3 Comments
I would love to have this - or the ms to compile feature from GN for shaders. Or even stats on draw calls or more. This is super useful for production and render optimization - right now it's optimizing by trial and error.
Draw calls would be useful for Eevee. With Cycles, I know there is a debug pass for number of samples per pixel. But definitely would be nice to have something more universal between render engines.
in the early d days of raytracing POV-Ray could generate simply another layer (an additional image) which displayed the rendertime per pixel. Shouldn't it be possible to create such a layer in Blender, too?