
"Normalize Individually," option in graph editor
Often times when I'm animating motion graphics I find myself animating two properties at once such as animating the location and the scale at the same time.
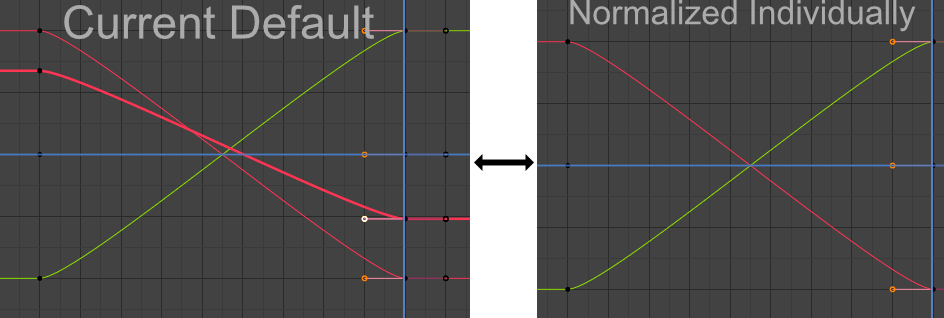
The "Normalize," function is super helpful in tweaking the motion curves in most cases, but I found that if the two properties operate on different scales (size is 1->0.75, and location is something like -50->200) then the curves will not match up and make it difficult to tweak the motion in a consistent way.
This is why I propose we add a "Normalize Individually," checkbox which normalizes each curve separately so that curves of different properties better line up with each-other.
Alternatively (and I just got this idea while typing this) the option could instead normalize each point individually so that the animator can focus more on the transition between keyframes, instead of the value of the actual keyframes themselves.
EDIT: If other agree, and especially if one of the more notable voices on this site like this idea, I would definitely be onboard to implement it myself. I got commit sniped by literally 20 minutes last time I tried to contribute so I'd love to try my hand contributing again.
2 Comments
Sounds great but... Isn't this the case already?
* @-L0Lock- * It works like that most of the time, but (for some reason I haven't quite nailed down yet) some property curves don't do that.
I think this is due to the "range of motion," or whatever you want to call it being different between those properties IE: Position goes from <100, 100> to <-50, -50> while scale goes between <70> and <30>. Position has to represent a 150u movement, while scale is trying to represent only a 40u change, which, relative to the change in position, is much smaller.
The screenshot on the left was taken while I had "Normalize," on, where the curves on the top and bottom were the object's XY position, and the curve sagging in the middle was the object's XYZ scale.